Chapter 10. Sensors
Table of Contents
- 10.1. Sensors for Wind Resource Assessment and Wind Farm Monitoring
- 10.2. Sensors for Solar Resource Assessment
- 10.3. Other Sensors for Meteorological Purposes
- 10.4. Devices for Electrical Measurements
- 10.5. Research Applications
- 10.6. Anemometers
- 10.7. Wind Vanes
- 10.8. Ultrasonic Anemometers
- 10.9. Weather and Environmental Integrated Monitoring Stations
- 10.10. Temperature Humidity Sensors
- 10.11. Barometric Pressure Sensors
- 10.12. Solar Sensors
- 10.13. Precipitation Sensors
- 10.14. Multifunction Transducer, Power Meters and other Electrical Measurement Devices
- 10.15. Remote Sensing
- 10.16. Bats Detection
- 10.17. Lightning Detector
- 10.18. Soil Water Content
- 10.19. Soiling Measurement
- 10.20. Other RS-485 Sensors
Meteo-42 data loggers are designed for installation in wind and solar measurement campaigns. Thus the data logger is compatible with all relevant sensor types. Depending on the data logger type a different number of sensors can be connected to analog voltage, pulse or counter, digital, serial or status as well as analog current, current source and RS-485 channels. See also Chapter 11, Channels and Section 1.3, “Meteo-42 Series”.
Depending on the measurement campaign different sensors are required. Find below a list of measurement instruments for wind measurement and solar measurement purposes as well as a list of other meteorological sensors and different measurement devices.
![[Note]](admon/note.png) | Note |
|---|---|
If the sensor you want to connect is not listed in this manual, refer for technical
details and connection plans to the data sheets on the
Ammonit website or contact our sales team
(+49-30-6003188-0 or
|
10.1. Sensors for Wind Resource Assessment and Wind Farm Monitoring
In order to evaluate the wind conditions at a specific location, various measurements for wind resource assessment are required. According to IEC 61400-12-1 horizontal wind speed, wind direction as well as air density have to be measured. Wind energy is calculated as follows:
Equation 10.1. Calculation of Wind Energy [P]
where A is the area; ρ is the air density, ρ = p / (R • T), where p is the air pressure, T the air temperature and R the gas constant; v is the wind speed.
Therefore, wind speed (v) is the most important parameter, as wind energy (P) is proportional to the cube of wind speed. Δ1% wind speed ≈ Δ3% wind energy.
The following sensors are crucial for wind site assessment:
Table 10.1. Sensors for Wind Measurement
| Sensor | Description | Link | |||
|---|---|---|---|---|---|
| Anemometer (wind speed) |
| ||||
| Wind vane (wind direction) |
| ||||
| Temperature / Humidity sensor |
| ||||
| Barometric pressure sensor |
| Section 10.11, “Barometric Pressure Sensors” | |||
| Ultrasonic anemometer |
| Section 10.8, “Ultrasonic Anemometers” |
10.2. Sensors for Solar Resource Assessment
Certain solar measurements are necessary to design profitable solar power plants. Refer to the Ammonit website to learn more about solar measurement systems. Depending on application (e.g. PV, CSP, CPV) and size of the solar power plant different measurements are crucial.
Insolation combines Direct Normal Irradiation (DNI) and Diffuse Horizontal Irradiance (DHI). Both are linked according to the formula for Global Horizontal Irradiation (GHI):
Equation 10.2. Calculation of Global Horizontal Irradiation
where θ is the solar zenith angle.
On a sunny day the insolation is 100 % GHI, 20 % DNI and 80 % DNI·cos(θ).
Table 10.2. Sensors for Solar Measurement
| Sensor | Description | Link |
|---|---|---|
| Pyranometer |
| Section 10.12.1, “Pyranometers” |
| Pyrheliometer |
| Section 10.12.3, “Pyrheliometers” |
| Sunshine Duration sensor |
| |
| Solar Tracker |
| |
| Soiling Measurement |
|
Besides measuring the solar conditions at the site of the planned solar power plant, some additional measurements might be necessary to design the solar power plant, e.g. wind speed, wind direction, air temperature, relative humidity as well as air pressure (see Table 10.1, “Sensors for Wind Measurement”). In some cases soiling detectors and precipitation sensors are required.
10.3. Other Sensors for Meteorological Purposes
There are several sensors, which are not mandatory for wind and solar resource assessment, but provide important parameters for ground construction and other influential conditions, e.g. precipitation sensors.
Table 10.3. Sensors for Meteorological Purposes
| Sensor | Description | Link |
|---|---|---|
| Precipitation Rain Gauge |
| |
| Laser Precipitation Monitor |
|
10.4. Devices for Electrical Measurements
Meteo-42 can be used to connect power meters, multifunction transducers or other electrical measurement devices, e.g. for power curve measurement.
Table 10.4. Electrical Measurement Devices
| Device | Description | Link |
|---|---|---|
| Multifunction Transducer |
|
Section 10.14, “Multifunction Transducer, Power Meters and other Electrical Measurement Devices” |
10.5. Research Applications
Meteo-42 is also used for research applications. A large and always growing list of formulas, developed and tested in collaboration with specialists, is included in the Evaluation Helper. For a complete list of the available formulas see Section 5.3.1, “Evaluation Helper”. Thanks to the Evaluation Helper, it is possible to apply a linear formula to live measured data for later calculation of the standard statistics on this value. Most formulas combine different measurements and constants, like the air density, the covariance or a plain addition. Some special statistics related to turbulences analysis like Obukhov length or turbulence intensity can also be configured. The resulting value will be included in the statistics files.
In some research projects, a higher measurement rate can be needed. Over an RS-485 client (RS-485) port, Meteo-42 offers the possibility to record data from one RS-485 sensor with a maximum polling rate of 8 Hz. If more than one RS-485 sensor is connected to the RS-485 client, a maximum polling rate of 1 Hz is available. For the analog voltage channels Ax, analog current ACx and digital channels Dx, the highest measurement rate is 8 Hz. However, for counter channels Cx and period measurement Px the maximum is 1 Hz.
10.6. Anemometers
Anemometers measure the horizontal wind speed (velocity). This parameter is crucial for any wind site assessment. Cup anemometers are the general standard type of anemometers. They are robust and resistant to turbulence and skew winds caused by masts and traverses. Each anemometer should be individually calibrated and equipped with a certified calibration report according to international standards (e.g. MEASNET). At least two anemometers have to be installed on a met mast. Most anemometers can be equipped with electronically regulated heating.
Refer to the Ammonit website to learn more about anemometer behaviour and accuracy.
The wind speed (v) is determined by the linear function of the frequency (impulse) output (I):
Equation 10.3. Calculation of Wind Speed (v)
A counter value of 0 produces the minimal value, which matches the offset by default (see Equation 5.1, “Linear Equation for Wind Speed”).
For wind assessment campaigns it is required to perform an individual MEASNET calibration of each anemometer in a wind tunnel to achieve optimal accuracy. After calibration, use the values for slope and offset according to the calibration protocol.
Anemometers are connected to counter channels (Cx). Refer to Figure 13.9, “Electrical Connection Plan: Pulse Counter (Anemometer)” for the connection diagram. Further details about counter channels can be found in Section 11.2, “Connecting Sensors to Counter / Period Channels” and Section 12.2, “Electrical Characteristics”.
Anemometers can easily be configured in the Meteo-42 web interface via the Sensor Helper (see Section 5.1.2, “Sensor Helper”).
Table 10.5. Overview Anemometers
| Sensor | Order-No | Description |
|---|---|---|
| Thies Anemometer FCA X vibration extended - Modbus | S11200 / S11200H | See Section 10.6.1, “Thies First Class Advanced X” |
| Thies Anemometer FCA X inclination extended - Modbus | S11200 / S11200H | See Section 10.6.1, “Thies First Class Advanced X” |
| Thies Anemometer FCA X - Modbus | S11200 / S11200H | See Section 10.6.1, “Thies First Class Advanced X” |
| Thies Anemometer FCA X - ASCII | S11200 / S11200H | See Section 10.6.1, “Thies First Class Advanced X” |
| Thies Anemometer First Class Advanced | S11100/S11100H | |
| Thies Anemometer First Class | P6100H/P6100 | |
| Thies Anemometer Compact | S12100H | |
| Thies Anemometer Classic | P6121H | |
| Anemometer Vento First Class | ||
| Vector L100 First Class | S14100/S14100H | |
| Risø P2546A | S16100 | |
| Vaisala Anemometer WAA 252 | S15100H | |
| Young Propeller Anemometer Model 27106T | S17100 | See Section 10.6.2, “Propeller Anemometer Young” |
| NRG #40 Anemometer | S18200C | |
| NRG #40 Anemometer linear | S18200C | Pure linear formula |
| Second Wind C3 | ||
| Lambrecht Wind Professional 14522 | ||
| Young Wind Monitor | S17200 | |
| Met One 014 mini | ||
| Generic Anemometer | ||
| Generic Anemometer linear | Pure linear formula for NRG anemometers | |
| Generic Anemometer PM |
![[Important]](admon/important.png) | Important |
|---|---|
If you plan to install anemometer NRG #40H (Hall Effect), anemometer Risø P2546A (Reed switch) or anemometer Thies (if open drain is used), an external circuitry is needed. This can be solved by an external resistor or using an external module supplied by Ammonit. The external modules allow adaption for many different types of sensors and provide stabilized and ripple-free voltage supply for the sensors. Refer to the data sheet and contact Ammonit for further details. |
| Note |
|---|---|
For technical details and electrical characteristics of sensors, refer to the data sheets, which can be downloaded from the Ammonit website. |
Meteo-42 saves all electrically measured values to the source data (see Section 6.7, “Access to Source Data”). The calculated wind speed in m/s is saved to the CSV file (see Section 6.6.1, “Ammonit Meteo-42 specific details”).
| Note |
|---|---|
The CSV file contains for all active channels the electrical values according to the chosen statistical interval. |
10.6.1. Thies First Class Advanced X
The anemometer Thies First Class Advanced X is a cup anemometer that can be connected to an RS-485 client port and offers a list of aggregated information like vibration frequency, inclination, corrected an uncorrected wind speed. Thanks to the digital communication over an RS-485 bus, this supplementary information can synchronously be requested by Meteo-42.
The corrected wind speed (EC 61400-12-1 Edition 2.0 compliant) is the result of correcting the influence of the atmospheric pressure on the measured wind speed. Meteo-42 will acquire the measurement values of the lower table every second, including measured frequency, corrected and uncorrected wind speed and 3-axis vibration frequencies.
If a Modbus RTU implementation is used ('Thies FCA X - Modbus', 'Thies Anemometer FCA X vibration extended - Modbus' or 'Thies Anemometer FCA X inclination extended - Modbus') and the option RS-485 sensors check is active, the sensor will be uniquely identified during configuration by requesting its hardware ID, which will be written in the configuration file. The calibration table, which is applied to the measured frequency resulting from the uncorrected wind speed at the second position of the table, is also requested and saved in the configuration file. If any changes are detected in either the hardware ID or the calibration table, it is reflected in the logbook, including the time stamp when the calibration was performed and the number of the calibration certificate.
Table 10.6. Connecting Thies FCA X to Meteo-42
| Model | Channel (Protocol) | Description | Measurement Data | Required Configuration |
|---|---|---|---|---|
| Thies FCA X vibration extended - Modbus | RS-485 (Modbus RTU) | Registers 35013-35014, 35021-35022, 35025-35026, 35037-35050 |
Wind speed corrected (m/s)[a] Wind speed uncorrected (m/s)[b] Frequency (Hz)[c] Absolute atmospheric pressure (hPa) Status word[d] Vibration frequency X (Hz) Vibration amplitude X (mg) Vibration frequency Y (Hz) Vibration amplitude Y (mg) Vibration frequency Z (Hz) Vibration amplitude Z (mg) | serial settings, address |
| Thies FCA X inclination extended - Modbus | RS-485 (Modbus RTU) | Registers 35013-35014, 35019-35022, 35025-35026, 35031-35035, 35049-35050 |
Wind speed corrected (m/s)[a] Wind speed uncorrected (m/s)[b] Frequency (Hz)[c] Housing interior temperature (°C) Absolute atmospheric pressure (hPa) Status word[d] Inclination angle θ (°) Inclination angle ρ (°) Inclination angle φ (°) | serial settings, address |
| Thies FCA X one-step calibration - Modbus[e] | RS-485 (Modbus RTU) | Registers 35019-35022, 35025-35026, 35037-35050 |
Wind speed with configurable slope and offset (m/s)[f] Temperature (°C) Absolute atmospheric pressure (hPa) Status word[d] Vibration frequency X (Hz) Vibration amplitude X (mg)[g] Vibration frequency Y (Hz) Vibration amplitude Y (mg)[g] Vibration frequency Z (Hz) Vibration amplitude Z (mg)[g] | serial settings, address |
| Thies FCA X - Modbus | RS-485 (Modbus RTU) | Registers 35013-35014, 35019-35022, 35025-35026 |
Wind speed corrected (m/s)[a] Housing interior temperature (°C) Absolute atmospheric pressure (hPa) Status word[d] | serial settings, address |
| Thies FCA X - ASCII | RS-485 (Thies) | Telegram 2 |
Wind speed calculated with current calibration table (m/s) Wind speed calculated with standard curve (m/s) Wind speed corrected (m/s)[a] | serial settings, address |
| Thies FCA X - Counter | Counter |
Wind speed corrected (m/s)[a] | Parameter FO=4 (see sensor's manual) | |
[a] The air pressure compensated wind speed, based on the measured values recorded by means of the calibration curve (register 35013). [b] Wind speed calculated at data logger from Frequency and current calibration table. [c] Info: It is the directly measured, uncorrected frequency. Independent of the command FO (register 35049). [d] Provides information about the condition of the transmitter. [e] For the case that the calibration values are not saved in the sensor (not recommended). [f] Calibration slope and offset can be applied to the directly measured, uncorrected frequency. Independent of the command FO (register 35049). [g] Amplitude vibration unit is mg, where 1g = 9.81m/s². | ||||
10.6.2. Propeller Anemometer Young
The propeller anemometer can measure horizontal or vertical wind speed. However, it is not classified according to MEASNET and IEC. The anemometer is widely used to measure vertical wind speed to analyse turbulences and the wind load of a turbine.
The anemometer uses a transducer which converts linearly the rotational speed into DC voltage levels. It must be connected to an analog voltage channel (Ax) of your Meteo-42 data logger. Signal polarity relative to the connection pins is shown in the wiring diagram of the sensor. In applications measuring vertical air flow, the sensor is usually connected so downdrafts produce a negative signal and updrafts a positive signal.
The sensor can easily be configured in the Meteo-42 web interface via the
Sensor Helper (see Section 5.1.2, “Sensor Helper”). Different calibration offset and slope values can be introduced depending on the
signal polarity. Negative Signal slope and offset will be applied to
negative voltage measurements, resulting in a negative wind speed, whereas standard slope
and offset will be applied to positive voltage measurements, resulting in a positive wind
speed.
Table 10.7. Overview Propeller Anemometer
| Sensor | Order-No |
|---|---|
| Propeller Anemometer Young 27106T | S17100 |
| Note |
|---|---|
For technical details and electrical characteristics of sensors, refer to the data sheets, which can be downloaded from the Ammonit website. |
Meteo-42 stores all electrically measured values to the source data (see Section 6.7, “Access to Source Data”). The calculated wind speed in m/s is saved to the CSV file (see Section 6.6.1, “Ammonit Meteo-42 specific details”).
| Note |
|---|---|
The CSV file contains for all active channels the electrical values according to the chosen statistical interval. |
10.7. Wind Vanes
Wind vanes indicate the horizontal wind direction. The evaluation of the wind direction enables the best possible positioning of wind turbines. It is essential that a wind vane covers an entire 360° degree radius - without north gap.
Meteo-42 data loggers are capable of using different types of wind vanes: Digital Wind Vanes and Analog (potentiometric) Wind Vanes. The Meteo-42 data logger comprises digital interfaces to connect several Digital Wind Vanes.
In addition to Digital Wind Vanes Meteo-42 data loggers can make use of classical Analog Wind Vanes using a potentiometer. Ammonit suggests using a five wire setup with two analog voltage channels to eliminate measurement errors caused by cable length and voltage drops in the supply voltage of the wind vane.
Furthermore, wind direction can also be recorded using wind vanes with data transmission via RS-485 bus.
| Note |
|---|---|
It is possible to introduce an installation offset and a calibration offset for a
wind vane in the Sensor Helper (see Section 5.1.2, “Sensor Helper”) of the Meteo-42 web interface. These values are
internally added, but for documentation reasons there are two separate fields for
them. The Equation 10.4. Wind Direction Offset D[°] = D[°] +
offset[°] + installation
offset[°] |
10.7.1. Digital Wind Vanes Tunnel Magnetoresistance (TMR)
Ammonit recommends installing digital wind vanes TMR to determine the wind direction. Wind vanes TMR deliver higher precision and are less susceptible to mechanical wear because of their solid state design. Ammonit offers wind vane Thies First Class TMR 10-bit serial-synchron and wind vane Thies Compact TMR 10-bit serial-synchron.
Table 10.8. Comparison of Wind Vane Accuracy
| Wind Vane | Accuracy |
|---|---|
| Thies Compact TMR | ± 1° |
| Thies Compact POT | ± 2° |
| Thies First Class TMR | ± 0.5° |
| Thies First Class POT | ± 1° |
Each wind vane TMR requires one digital channel, whereas potentiometer wind vanes require two analog voltage channels each. By installing wind vanes TMR instead of wind vanes POT, analog voltage channels are available for other analog sensors, e.g. barometric pressure sensor, temperature or humidity sensors.
![[Tip]](admon/tip.png) | Tip |
|---|---|
Considering a measurement system with wind vanes TMR a smaller Meteo-42 model with less channels can be sufficient. |
Wind vanes TMR are connected to digital channels (Dx). Refer to Figure 13.11, “Electrical Connection Plan: Digital Serial for Serial Wind Vane (Thies TMR)” for the connection diagram. Further details about digital channels can be found in Section 11.3, “Connecting Sensors to Digital Channels” and Section 12.2, “Electrical Characteristics”.
Wind vanes can easily be configured in the Meteo-42 web interface via the Sensor Helper (see Section 5.1.2, “Sensor Helper”). The offset and installation offset are entered in degrees. The slope is also shown, but changing it is strongly discouraged. The 10-bit gray code measured by the digital channel is multiplied by the slope to produce an angle. The 10-bit gray code is between 0 and 2¹⁰, so any slope besides 360 / 1024 = 0.3515625 will produce incorrect results. If the wind vane calibration indicates a slope close to 1, the product of the two slopes could be configured instead, but doing so is not recommended.
Table 10.9. Overview Wind vanes TMR
| Sensor | Order-No |
|---|---|
| Thies First Class | S21100H |
| Thies Compact | S22100 / S22100H |
| Note |
|---|---|
For technical details and electrical characteristics of sensors, refer to the data sheets, which can be downloaded from the Ammonit website. |
Equation 10.5. 10-bit digital wind vane formula
10.7.2. Wind Vanes with Potentiometer
To determine the wind direction with a potentiometer wind vane, e.g. Thies First
Class and Thies Compact, Ammonit recommends using a five wire connection between data
logger and wind vane. This five wire connection eliminates voltage drops across the
connection cables and also eliminates the negative impact of voltage drops in the
sensor's supply. Select the
Generic Analog Wind Vane sensor type to connect any wind vane using
this equation with the voltage range -10 V–+10 V.
The five wire connection method makes use of two consecutive analog voltage channels of the Meteo-42 data logger: An, An+1. An records the total voltage of the potentiometer (voltage between vane supply and Ground), An+1 measures the voltage between wiper and Ground. The following equation shows the calculation of the wind direction (D).
Equation 10.6. Calculation of the Wind Direction (D)
Refer to Figure 13.7, “Electrical Connection Plan: Analog Voltage (Potentiometric Wind Vane)” for the connection diagram. Further details about analog voltage channels can be found in Section 11.1, “Connecting Sensors to Analog Voltage Channels” and Section 12.2, “Electrical Characteristics”
Table 10.10. Parameters for the configuration of potentiometric wind vanes
| Sensor | Order-No | Offset |
|---|---|---|
| Thies First Class | S21200H | 0° (if aligned to the North) |
| Thies Compact | S22200 / S22200H | 0° (if aligned to the North) |
| Important |
|---|---|
If potentiometric wind vanes, e.g. Thies First Class, Thies Compact, Vector W200P, Vector W200P/L, NRG #200P additional resistors for current limitation have to be used in the wiring setup. Contact Ammonit regarding further details about the accessory module! |
| Note |
|---|---|
For technical details and electrical characteristics of sensors, refer to the data sheets, which can be downloaded from the Ammonit website. |
Meteo-42 stores all electrically measured values to the source data (Section 6.7, “Access to Source Data”). The calculated wind direction in ° (degree) is saved to the CSV file (see Section 6.6.1, “Ammonit Meteo-42 specific details”).
| Note |
|---|---|
The CSV file contains the electrical values according to the chosen statistical interval for all active measurement channels. |
10.7.3. Wind Vanes connected to RS-485 client
Certain wind vanes have an RS-485 interface. Meteo-42 data loggers can address up to 24 smart sensors on the RS-485 buses.
| Important |
|---|---|
If you intend to connect more than one sensor to an RS-485 client port, all connected sensors must use the same protocol and serial settings. Additionally, each sensor needs a unique ID (RS-485 address), which has to be configured for the sensor. The transmission mode for all RS-485-connected sensors has to be configured as half duplex. See Section 11.6, “Connecting Sensors to RS-485 Client”. |
Wind vanes can easily be configured in the Meteo-42 web interface via the Sensor Helper (see Section 5.1.2, “Sensor Helper”). See Table 10.11, “Configuration of RS-485 Wind Vanes” for the configuration of RS-485 wind vanes.
Table 10.11. Configuration of RS-485 Wind Vanes
| Model | Protocol | Description | Channels / Evaluated Data | Required Configuration |
|---|---|---|---|---|
| Thies Wind Vane TMR RS-485 | Thies | Telegram 3 |
RxCy_1: Wind direction | Serial settings, address, half duplex mode |
| Thies Wind Vane First Class RS-485 | Thies | Telegram 3 |
RxCy_1: Wind speed RxCy_2: Wind direction | Serial settings, address, half duplex mode |
| Thies Wind Vane 8-bit parallel via ICP DAS I7051 | DCON | RS-485 module to connect two Thies 8-bit parallel wind vanes |
RxCy_1: Wind direction vane DI: 0–7 RxCy_2: Wind direction vane DI: 8–15 | Serial settings: 38400 8N1, address: 6, checksum: disabled |
Meteo-42 stores all measured values to the source data (Section 6.7, “Access to Source Data”). The wind direction in ° (degree) is saved to the CSV file (see Section 6.6.1, “Ammonit Meteo-42 specific details”).
10.7.4. Kintech Geovane™
The Kintech Geovane™ can be connected to Meteo-42 on two different ways: via RS-485 or three analog channels (two analog voltage channels A and one counter C).
It is possible to combine the True-North direction with a measured wind direction at one-second level by means of the Evaluation Helper formula Wind direction true-north. The results will be included in a new column of the CSV statistics files.
Table 10.12. Kintech Geovane™
| Model | Protocol | Description | Channels / Evaluated Data | Required Configuration |
|---|---|---|---|---|
| Kintech Geovane™ Analog |
Cx: Direction True-North Ax: Angle of inclination X Ay: Angle of inclination Y | Analog output must be activated | ||
| Kintech Geovane™ ORN | NMEA [a] | ORN message |
RxCy_1: Direction True-North RxCy_2: Angle of inclination X RxCy_3: Angle of inclination Y RxCy_4: Status byte[b] | serial settings, address |
[a] Compatible with Thies ASCII protocol. [b] Any value different from 0 indicates an error. See sensor's manual for more detailed information. | ||||
10.8. Ultrasonic Anemometers
Ultrasonic anemometers must be connected to an RS-485 client port (see Section 11.6, “Connecting Sensors to RS-485 Client”). 2D ultrasonic anemometers measure horizontal wind speed, wind direction and acoustic virtual temperature. 3D ultrasonic anemometers also measure the vertical wind velocity, which is important for turbulence and wind load calculations.
| Important |
|---|---|
If you intend to connect more than one sensor to an RS-485 client port, all connected sensors must use the same protocol and serial settings. Additionally, each sensor needs a unique ID (RS-485 address), which has to be configured for the sensor. The transmission mode for all RS-485-connected sensors has to be configured as half duplex. See Section 11.6, “Connecting Sensors to RS-485 Client”. |
The following ultrasonic anemometers are included in the Meteo-42 sensor helper for easy configuration. More Modbus sensors can be configured as Other sensor.
| Model | Protocol | Description | Channels / Evaluated Data | Required Configuration |
|---|---|---|---|---|
| Thies 2D Anemometer | Thies | Telegram 3 |
RxCy_1: Wind speed RxCy_2: Wind direction RxCy_3: Acoustic virtual temperature RxCy_4: Thies Status Byte[a] | serial settings, address, half duplex mode, scalar averaging over 1 s |
| Thies 3D Anemometer | Thies | Telegram 3 |
RxCy_1: Wind speed azimuth RxCy_2: Wind direction azimuth RxCy_3: Wind speed elevation RxCy_4: Acoustic virtual temperature RxCy_5: Thies Status Byte[a] | serial settings, address, half duplex mode, scalar averaging over 1 s |
| NMEA - Thies Compact Anemometer | NMEA | Telegram 3 |
RxCy_1: Wind direction RxCy_2: Wind speed | serial settings, address, NMEA protocol, half duplex mode, scalar averaging over 1 s |
| Lufft 2D VENTUS-V200A-UMB | Modbus RTU | input registers 14 and 25 |
RxCy_1: Wind direction RxCy_2: Wind speed | serial settings, address, Modbus RTU protocol, parity none |
| Gill Wind Master Pro 3D | Gill | Mode 4 |
RxCy_1: Wind direction azimuth RxCy_2: Wind speed azimuth RxCy_3: Wind speed elevation RxCy_4: Sonic temperature (if activated) | serial settings (B5: 38400 bps, 8N1), address (default Q), averaging inactive (G0), sampling rate 20 Hz (P8), polar polled (M4), output format CSV (O1), Sonic temperature activated (A3) |
| Gill Wind Master Pro 3D - M3 | Gill | Mode 3 |
RxCy_1: Wind speed X RxCy_2: Wind speed Y RxCy_3: Wind speed Z RxCy_4: Sonic temperature (if activated) | serial settings (B5: 38400 bps, 8N1), address (default Q), averaging inactive (G0), sampling rate 20 Hz (P8), UVW polled (M3), output format CSV (O1), Sonic temperature activated (A3) |
| Gill Wind Master Pro 3D - XYZT | Gill | Mode 4 |
RxCy_1: Wind speed X RxCy_2: Wind speed Y RxCy_3: Wind speed Z RxCy_4: Sonic temperature (if activated) | serial settings (B5: 38400 bps, 8N1), address (default Q), averaging inactive (G0), sampling rate 20 Hz (P8), polar polled (M4), output format CSV (O1), Sonic temperature activated (A3) |
| Gill Wind Observer / WindSonic 2D Anemometer | Gill | Mode 4 |
RxCy_1: Wind direction azimuth RxCy_2: Wind speed azimuth RxCy_3: Sonic temperature (if activated) | serial settings (B5: 38400 bps, F1: default 8N1), address (default A), averaging inactive (G0), sampling rate 20 Hz (P8), polar polled (M4), output format CSV (O1), Sonic temperature optionally activated (A2) |
| Vaisala WMT700 NMEA MWV | NMEA | WMT700 NMEA MWV Data Message |
RxCy_1: Wind direction RxCy_2: Wind speed | autoSend = 0 (automatic messages disabled), com2_protocol = 11 (WMT700 NMEA profile for serial port COM2 MWV protocol), com2_interf = 0 (RS-485 interface for serial port COM2), com2_delay = 10, wndUnit = 0 (m/s wind speed unit), address = WI (Weather Instruments), device identifier = II |
[a] Last value of the statistics interval of the Thies status byte. Typical values for a correct behaviour are: 14 (heating off), 206 (heating on). Values between 2 and 13 (heating off) and between 194 and 205 (heating on) indicate reduced measurement availability. Values 97 and 225 indicate general malfunction. For more information see sensor's manual. | ||||
10.8.1. NMEA MWV V 2.0
Supported NMEA telegram: $WIMWV,<dir>,<ref>,<spd>,<uni>,<sta>*<chk><CR> <LF>
<dir>: Wind direction xxx.x
<ref>: Reference R = relative
<spd>: wind speed xxx.x
<uni>: Wind speed unit M = m/s
<sta>: Status A = valid
<chk>: Checksum (8-bit XOR, excluding $ and *)
<CR>: Carriage return code, ASCII 0DH
<LF>: Line feed code, ASCII 0AH
10.8.2. Thies Ultrasonic Configuration Options
Before connecting any Thies sensor to an RS-485 client port, it has to be configured. Three Thies ultrasonic types are available: 2D compact, 2D and 3D. You can use the Thies Device Utility software to configure your sensors (Thies Device Utility software).
Ammonit recommends configuring Thies ultrasonic sensors as follows:
Required settings
Half duplex for transmission mode
Unique ID for each sensor connected to the bus
Heating ON/OFF
Further Thies-specific settings
Voltage threshold for heating suppression: 17 V (HC=17)
Serial settings: 38400 bps, 8N1 (data format)
Average mode: scalar-averaged velocity and vectorial-averaged angle (AM=2)
| Tip |
|---|---|
For more information about Thies acoustic virtual temperature, see sensor's manual. |
10.8.3. Lufft UMB Configuration Tool
Before connecting any Lufft sensor to Meteo-42, it has to be configured. Download and install the software UMB-Config-Tool and follow the next steps:
Power on the sensor.
Connect sensor's A-, B+ to your computer using RS-485 to USB or RS232 adapter.
Start Config-Software-UMB and setup the connection in the → menu.
In order to configure the sensor, switch all sensors temporarily to UMB protocol in the Options menu (follow instructions).
Add the new sensor in the → menu. Select the appropriate type from the list and ID (default 1). Do not exit this menu, press Configure to access the sensor configuration.
Load the profile from the sensor (press the button again, if it does not respond). Select the tab with sensor type name and configure as described in the table above (see Section 10.8, “Ultrasonic Anemometers”).
Store profile on sensor to apply the configuration changes to the sensor. Save the profile also to your disk to keep a copy of the sensor configuration.
Close the configuration program, disconnect and power off the sensor. Connect the sensor to the data logger and power on the sensor.
Add the sensor to the sensor list of the data logger in the → menu, applying the same configuration.
10.8.4. Gill Wind Configuration Tool
Before connecting any Gill sensor to Meteo-42, it must be configured accordingly.
Download and install Gill Wind Com.
Use the Wizard tool to change from the default configuration all parameters specified in the upper table (see Section 10.8, “Ultrasonic Anemometers”).
Use a different address for each unit connected to an RS-485 client port. It is recommended that letters A to F, K, M, N, and P are not used since they can appear in a data string and might result in erroneous poll responses.
Do not forget to save the configuration report in the Tools menu.
Close the configuration program, disconnect and power off the sensor. Connect the sensor to the data logger and power on the sensor.
Add the sensor to Meteo-42 sensors list in the → menu, applying the same configuration.
| Note |
|---|---|
Any wind magnitude lower than defined by sensor's parameter K (default 0.050 m/s) will omit the wind direction. |
| Important |
|---|---|
Gill Wind Master sensors with firmware v7.01 can be networked with other Wind Master units on a 2-wire RS-485 bus. Units with older versions cannot be networked. |
10.9. Weather and Environmental Integrated Monitoring Stations
Weather and environmental stations are capable of measuring a large amount of atmospheric conditions in only one device. To acquire this data the preferred connection is RS-485. These sensors can be connected to an RS-485 client port (see Section 11.6, “Connecting Sensors to RS-485 Client”).
| Important |
|---|---|
If you intend to connect more than one sensor to an RS-485 client port, all connected sensors must use the same protocol and serial settings. Additionally, each sensor needs a unique ID (RS-485 address), which has to be configured for the sensor. The transmission mode for all RS-485-connected sensors has to be configured as half duplex. See Section 11.6, “Connecting Sensors to RS-485 Client”. |
The following weather and environmental stations are included in the Meteo-42 sensor helper for easy configuration. More Modbus sensors can be configured as Other sensor.
| Model | Protocol | Description | Channels / Evaluated Data | Required Configuration |
|---|---|---|---|---|
| Weather Station Thies Clima US MODBUS | Modbus RTU | input registers 35001-35006, 35013, 35014, 35017, 35018, 35029, 35030, 35033-35040 |
RxCy_1: Wind speed RxCy_2: Wind direction RxCy_3: Temperature RxCy_4: Humidity RxCy_5: Air pressure RxCy_6: Direction of brightness RxCy_7: Precipitation status RxCy_8: Precipitation intensity RxCy_9: Precipitation sum RxCy_10: SYNOP | BR=384, DM=0 |
| Weather Station Thies Clima US | Thies | Telegram 6 |
RxCy_1: Wind speed RxCy_2: Wind direction RxCy_3: Temperature RxCy_4: Humidity RxCy_5: Air pressure RxCy_6: Brightness max. value RxCy_7: Direction of brightness RxCy_8: Precipitation status RxCy_9: Precipitation intensity RxCy_10: Precipitation sum RxCy_11: SYNOP | BR=384, DM=0, DT=0, TT=0, RD=5 |
| Weather Station Thies Clima US VDTHP | Thies | Telegram 2 |
RxCy_1: Wind speed RxCy_2: Wind direction RxCy_3: Temperature RxCy_4: Humidity RxCy_5: Air pressure | BR=384, DM=0, DT=0, TT=0, RD=5 |
| Lufft Weather station WS | Modbus RTU |
input registers 10, 14, 22, 31 and 47 |
RxCy_1: Relative humidity (act.) RxCy_2: Rel. air pressure (act.) RxCy_3: Wind direction fast RxCy_4: Air temperature (act.) RxCy_5: Wind speed fast | serial settings (38400 bps), address, Modbus RTU protocol, parity none |
| Lufft Weather station WS 200 | Modbus RTU |
input registers 22, 24 and 47 |
RxCy_1: Wind direction fast RxCy_2: Compass direction RxCy_3: Wind speed fast | serial settings (38400 bps), address, Modbus RTU protocol, parity none |
| Lufft Weather station WS 300 | Modbus RTU |
input registers 10, 14 and 31 |
RxCy_1: Relative humidity (act.) RxCy_2: Rel. air pressure (act.) RxCy_3: Air temperature (act.) | serial settings (38400 bps), address, Modbus RTU protocol, parity none |
| Lufft Weather station WS 502 | Modbus RTU |
input registers 10, 14, 22, 27, 31 and 47 |
RxCy_1: Relative humidity (act.) RxCy_2: Rel. air pressure (act.) RxCy_3: Wind direction fast RxCy_4: Global radiation (act.) RxCy_5: Air temperature (act.) RxCy_6: Wind speed fast | serial settings (38400 bps), address, Modbus RTU protocol, parity none |
| Lufft Weather station WS 600 | Modbus RTU |
input registers 10, 14, 22, 24, 25, 31, 47, 48, 49 and 50 |
RxCy_1: Relative humidity (act.) RxCy_2: Rel. air pressure (act.) RxCy_3: Wind direction fast RxCy_4: Compass direction RxCy_5: Precipitation type RxCy_6: Air temperature (act.) RxCy_7: Wind speed fast RxCy_8: Precipitation Quantity Absolute RxCy_9: Precipitation Quantity Difference RxCy_10: Precipitation Intensity | serial settings (38400 bps), address, Modbus RTU protocol, parity none |
| Lufft Weather station WS 601 | Modbus RTU |
input registers 10, 14, 22, 24, 25, 31, 47, 48, 49 and 50 |
RxCy_1: Relative humidity (act.) RxCy_2: Rel. air pressure (act.) RxCy_3: Wind direction fast RxCy_4: Compass direction RxCy_5: Precipitation type RxCy_6: Air temperature (act.) RxCy_7: Wind speed fast RxCy_8: Precipitation Quantity Absolute RxCy_9: Precipitation Quantity Difference RxCy_10: Precipitation Intensity | serial settings (38400 bps), address, Modbus RTU protocol, parity none |
| Gill MaxiMet GMX600 | Modbus RTU | registers 2 to 20 |
RxCy_1: Wind direction RxCy_2: Wind speed RxCy_3: Wind direction corrected RxCy_4: Air pressure RxCy_5: Humidity RxCy_6: Temperature RxCy_7: Dew point RxCy_8: Precipitation sum RxCy_9: Precipitation intensity | serial settings, address |
| WDS308 integrated dust monitoring sensor | Modbus RTU | registers 1 to 14 |
RxCy_1: Wind direction RxCy_2: Wind speed RxCy_3: Temperature RxCy_4: Humidity RxCy_5: Air pressure RxCy_6: Precipitation sum RxCy_7: Global irradiance RxCy_8: UV Index RxCy_9: Noise RxCy_10: Particulate Matter PM2.5 RxCy_11: Particulate Matter PM10 | averaging interval 1s, serial settings, address |
| LSI Lastem DNB201 | Modbus RTU | registers 0 to 18 |
RxCy_1: Wind speed RxCy_2: Wind direction RxCy_3: Temperature RxCy_4: Humidity RxCy_5: Air pressure RxCy_6: Minute precipitation RxCy_7: Hour precipitation RxCy_8: Day precipitation RxCy_9: Total precipitation | serial settings, address |
| Weather Station Biral SWS-100 RS-485 | Biral | "CC", "EE,EE", "FFF" in standard data message |
RxCy_1: SYNOP [a] RxCy_2: Meteorological optical range (km) | RS-485 mode, OSAM0 automatic telegram off, half-duplex wiring, minimum measurement period 10 s |
| Weather Station Biral SWS-100 Analog | Default range: 10m to 2km |
Ax: Meteorological optical range (m) | ||
[a] Present weather codes. From WMO Table 4680 (Automatic Weather Station). XX: Not Ready, 00: No Significant weather observed, 04: Haze or smoke, 30: Fog, 40: Indeterminate precipitation type, 50: Drizzle, 60: Rain, 70: Snow. | ||||
10.10. Temperature Humidity Sensors
Temperature sensors measure the air temperature, while humidity sensors measure the air humidity. Both sensors are often applied in combination to reduce cost.
Temperature humidity sensors, e.g. Galltec Active KP, Galltec Active TP, have to be connected to analog voltage channels (Ax). Refer to Figure 13.4, “Electrical Connection Plan: Analog Voltage (Temperature + Humidity Sensor)” for the connection diagram.
The output signal (U) from the temperature sensor is proportional to the temperature (T) in °C.
Equation 10.7. Calculation of Temperature (T)
The output signal (U) from the humidity sensor is proportional to the humidity (RH) in %.
Equation 10.8. Calculation of Humidity (RH)
Slope and
Offset are internal parameters of the sensor, which are important to
calculate temperature (T) in °C and humidity (RH) in %. Both values are pre-configured in
the
Sensor Helper (see
Section 5.1.2, “Sensor Helper”).
| Note |
|---|---|
For more flexibility, when connecting the combined Galltec temperature and humidity sensor to Meteo-42, two different Galltec Active KP sensors are listed in the Sensor Helper (see Section 5.1.2, “Sensor Helper”). Two analog channels are needed and thus the order of the signals to be connected is selectable. "Galltec Thermo-Hygro Active KP" assigns the first analog channel to temperature and the second to humidity. As opposite, "Galltec Hygro-Thermo Active KP" assigns the first channel to humidity and the second to temperature. |
Table 10.13. Parameters for the configuration of temperature humidity sensors
| Sensor | Order-No | Slope | Offset | ||||
|---|---|---|---|---|---|---|---|
| Galltec Active KP (Temperature + Humidity) | S52100 |
|
| ||||
| Galltec Active TP (Temperature) | S42100 |
|
|
| Important |
|---|---|
If you install calibrated sensors, enter the values given in the calibration protocol. |
Meteo-42 saves all electrically measured values in
V to the source data
(Section 6.7, “Access to Source Data”). The calculated values for temperature (°C) and humidity
(%) are saved to the CSV file (see
Section 6.6.1, “Ammonit Meteo-42 specific details”).
| Note |
|---|---|
The CSV file also contains for all active channels the electrical values according to the chosen statistical interval. |
| Note |
|---|---|
For technical details and electrical characteristics of sensors, refer to the data sheets, which can be downloaded from the Ammonit website. |
10.10.1. Resistance Temperature Detectors (RTD) / Pt100 / Pt1000
RTDs measure the temperature by correlating the resistance of the RTD element with temperature. Those sensors provide high accuracy and repeatability; the sensors are suitable for precision applications. RTDs use electrical resistance and require a power source to operate.
Platinum Resistance Thermometers (Pt100 / Pt1000) are classified according to DIN EN 60751 - see tolerance classes below.
Table 10.14. Tolerance Classes - Platinum Resistance Thermometers (Pt100)
| Tolerance Class | Tolerance in K |
|---|---|
| Class B1/3 DIN | ±(0.10 K + 0.0017 × [t]) |
| Class A | ±(0.15 K + 0.002 × [t]) |
| Class B | ±(0.30 K + 0.005 × [t]) |
| Class 0.5 | ±(0.50 K + 0.006 × [t]) |
Pt100 / Pt1000 sensors have to be connected to the analog voltage channel and the current source of Meteo-42 data loggers. The sensors can easily be configured via the Sensor Helper (see Section 5.1.2, “Sensor Helper”) in the Meteo-42 web interface.
Meteo-42 saves all electrically measured values in
V to the source data
(Section 6.7, “Access to Source Data”). The calculated value for temperature ( °C) is saved to
the CSV file (see
Section 6.6.1, “Ammonit Meteo-42 specific details”).
| Note |
|---|---|
The CSV file also contains for all active channels the electrical values according to the chosen statistical interval. |
10.10.2. Temperature Humidity Sensors connected to RS-485 client
Some available temperature humidity sensors have to be connected to a Meteo-42 RS-485 client bus. The sensors can easily be configured in the Meteo-42 web interface via the Sensor Helper (see Section 5.1.2, “Sensor Helper”).
| Important |
|---|---|
If you intend to connect more than one sensor to an RS-485 client port, all connected sensors must use the same protocol and serial settings. Additionally, each sensor needs a unique ID (RS-485 address), which has to be configured for the sensor. The transmission mode for all RS-485-connected sensors has to be configured as half duplex. See Section 11.6, “Connecting Sensors to RS-485 Client”. |
Table 10.15. Data request for RS-485 Temperature Humidity Sensors
| Model | Protocol | Description | Channels / Evaluated Data | Required Configuration |
|---|---|---|---|---|
| Galltec Thermo/Hygro KPC.MS | Modbus RTU | registers 0, 1, 3, 4 |
RxCy_1: Temperature RxCy_2: Humidity | Fixed serial settings (19200 8N1) |
| Campbell Hygro/Thermo CS215 | SDI-12 | D0 |
RxCy_1: Temperature RxCy_2: Humidity | External module needed (address, 19200 8N1, 120Ω termination). See SDI-12 |
| PTH Thies Compact - RS-485 Modbus | Modbus RTU | registers 35001 - 35013 |
RxCy_1: Absolute air pressure RxCy_2: Reduced air pressure RxCy_3: Relative humidity RxCy_4: Air temperature RxCy_5: Dew point temperature RxCy_6: Sensor Status[a] | serial settings, address |
| PTH Thies Compact - RS-485 ASCII | Thies | Telegram 3 |
RxCy_1: Absolute air pressure RxCy_2: Reduced air pressure RxCy_3: Relative humidity RxCy_4: Air temperature RxCy_5: Dew point temperature RxCy_6: Absolute humidity[b] RxCy_7: Sensor Status[a] | serial settings, address |
| PTH Rika RK330-01 - RS-485 | Modbus RTU | registers 0 - 2 |
RxCy_1: Temperature RxCy_2: Humidity RxCy_3: Air pressure | serial settings: default (9600, 8N1), address: 01, FC: 03 |
[a] Any value different from 0 indicates an error. See sensor's manual for more detailed information. [b] Absolute humidity only avaiable for sensor firmware version V3.09 or later | ||||
Meteo-42 saves all measured values to the source data (Section 6.7, “Access to Source Data”). The values for temperature (°C) and humidity (%) are saved to the CSV file ( see Section 6.6.1, “Ammonit Meteo-42 specific details”).
10.11. Barometric Pressure Sensors
Barometric pressure sensors measure the air pressure. Air pressure and air temperature should be evaluated for an accurate wind site assessment. It is recommended including an air pressure sensor as part of a measuring system.
Barometric pressure sensors, e.g. AB60, AB100 and Vaisala PTB110, have to be connected to analog voltage channels (Ax). Refer to Figure 13.3, “Electrical Connection Plan: Analog Voltage (Temperature / Barometric Pressure Sensor)” for the connection diagram.
The output signal (U) from the barometric pressure sensor is proportional to the air pressure (P).
Equation 10.9. Calculation of Air Pressure (P)
Slope and
Offset are internal parameters of the sensor, which are important to
calculate the air pressure in hPa. Both values are pre-configured for sensors listed in the
library of the
Sensor Helper (see
Section 5.1.2, “Sensor Helper”).
Table 10.16. Parameters for the configuration of barometric pressure sensors
| Sensor | Order-No | Slope | Offset | |||
|---|---|---|---|---|---|---|
| Ammonit AB60 | S31100 | 60 mbar/V | 800 mbar | |||
| Ammonit AB100 | S31200 | 100 mbar/V | 600 mbar | |||
| Vaisala PTB110 |
| 60 mbar/V | 800 mbar |
| Important |
|---|---|
If you install calibrated sensors, enter the values given in the calibration protocol. |
Meteo-42 saves all electrically measured values in
V to the source data
(Section 6.7, “Access to Source Data”). The calculated air pressure value in mbar is saved to the
CSV file (see
Section 6.6.1, “Ammonit Meteo-42 specific details”).
| Note |
|---|---|
The CSV file contains for all active channels the electrical values according to the chosen statistical interval. |
| Note |
|---|---|
For technical details and electrical characteristics of sensors, refer to the data sheets, which can be downloaded from the Ammonit website. |
10.11.1. Barometric Pressure Sensors connected to RS-485 client
Certain barometric pressure sensors have to be connected to a Meteo-42 RS-485 client bus The sensors can easily be configured in the Meteo-42 web interface via the Sensor Helper (see Section 5.1.2, “Sensor Helper”).
| Important |
|---|---|
If you intend to connect more than one sensor to an RS-485 client port, all connected sensors must use the same protocol and serial settings. Additionally, each sensor needs a unique ID (RS-485 address), which has to be configured for the sensor. The transmission mode for all RS-485-connected sensors has to be configured as half duplex. See Section 11.6, “Connecting Sensors to RS-485 Client”. |
Table 10.17. Data request for RS-485 Barometric Pressure Sensors
| Model | Protocol | Description | Channels / Evaluated Data | Required Configuration |
|---|---|---|---|---|
| Thies Baro Transmitter | Thies | Telegram 1 |
RxCy_1: Air pressure RxCy_2: Temperature | serial settings, address |
Meteo-42 saves all measured values to the source data (Section 6.7, “Access to Source Data”). The air pressure value in hPa is saved to the CSV file (see Section 6.6.1, “Ammonit Meteo-42 specific details”).
10.12. Solar Sensors
10.12.1. Pyranometers
Pyranometers measure the global horizontal radiation. They are also used as reference instruments thanks to their measurement precision. The use of this sensor is crucial for measurements with solar-powered applications.
Meteo-42 indicates for pyranometers the global horizontal irradiation (GHI).
Pyranometers, e.g. MS series of EKO Instruments or CMP series of Kipp & Zonen, have to be connected to analog voltage channels (Ax). Refer to Figure 13.2, “Electrical Connection Plan: Analog Voltage (Pyranometer)” for the connection diagram.
The output signal (U) from the pyranometer is proportional to the solar irradiance (E) in W/m².
Equation 10.10. Calculation of Solar Irradiance (E)
Sensitivity is an internal parameter of the sensor, which is important
to calculate the radiation in W/m². The value is given in the calibration certificate of
the sensor.
Table 10.18. Pyranometers
| Sensor | Order-No |
|---|---|
| CMP 3 | S61100 |
| CMP 6 | S61110 |
| CMP 10 | S61130 |
| CMP 11 | S61120 |
| EKO ML-01 | S64350 |
| EKO MS-40 | S64111 |
| EKO MS-410 | S64130 |
| EKO MS-60 | S64131 |
| EKO MS-602 | S64110 |
| EKO MS-60M (RS-485) | S64160 |
| EKO MS-60S (RS-485) | S64137 |
| EKO MS-80A | S64150 |
| EKO MS-80M (RS-485) | S64160 |
| EKO MS-80S (RS-485) | S64185 |
| EKO MS-802 | S64120 |
| EKO MS-90+ (RS-485) | |
| Kipp & Zonen CMP11 | S61120 |
| Kipp & Zonen CMP6 | S61110 |
| Kipp & Zonen CMP3 | S61100 |
| Kipp & Zonen SMP10 (RS-485) | S61430 / S61420 |
| Hukseflux Pyranometer LP 02 | S63100 |
| Hukseflux Pyranometer SR 11 | S63120 |
| Hukseflux Pyranometer SR30 (RS-485) | |
| Hukseflux Pyranometer SR300-D1 (RS-485) | |
| Hukseflux Pyranometer SR15-D1 (RS-485) | |
| Hukseflux Pyranometer SR20-T1 | |
| SP Lite2 | S61180 |
| Silicon Irradiance Sensor MT 0-1V | S68310 / S68320 / S68330 |
| Silicon Irradiance Sensor MT 0-10V | S68100 |
| Silicon Irradiance Sensor MT 4-20mA | S68110 / S68210 |
| Silicon Irradiance Sensor SiS-13TC-T | S68250 |
| Li-Cor LI-200SZ | |
| ISET Solar Radiation Sensor | |
| Datasol MET Reference Cell (RS-485) |
Meteo-42 saves all electrically measured values in
V to the source data
(Section 6.7, “Access to Source Data”). The calculated values for solar radiation are saved in
W/m² to the CSV file (see
Section 6.6.1, “Ammonit Meteo-42 specific details”).
| Note |
|---|---|
The CSV file also contains for all active channels the electrical values according to the chosen statistical interval. |
| Note |
|---|---|
For technical details and electrical characteristics of sensors, refer to the data sheets, which can be downloaded from the Ammonit website. |
Some pyranometers can or must be connected to an RS-485 client port. For EKO pyranometers, it is also possible to use the M-Box RS-485 Modbus RTU adapter and connect analog pyranometers to an RS-485 client bus. If more than one sensor is connected to an RS-485 client bus, they must be configured with a unique Modbus ID and they must all share the same protocol and serial settings (see Section 11.6, “Connecting Sensors to RS-485 Client”).
Table 10.19. Data request for RS-485 pyranometer
| Model | Protocol | Description | Channels / Evaluated Data | Required Configuration |
|---|---|---|---|---|
| Hukseflux Pyranometer SR30 | Modbus RTU | registers 2 to 7 |
R1C1_1: Global Irradiance Compensated (W/m²) R1C1_2: Global Irradiance Uncompensated (W/m²) R1C1_3: Internal Temperature (°C) | serial settings (default 9600, 8N2) |
| Hukseflux Pyranometer SR300-D1 | Modbus RTU | registers 512 to 517 |
R1C1_1: Global Irradiance Compensated (W/m²) R1C1_2: Internal Temperature (°C) R1C1_3: Global Irradiance Uncompensated (W/m²) | serial settings (default 19200, 8E1) |
| Hukseflux Pyranometer SR15-D1 | Modbus RTU | registers 2, 3, and 6 |
R1C1_1: Global Irradiance(W/m²) R1C1_2: Internal Temperature (°C) | serial settings (default 19200, 8E1) |
| EKO MS-60M | Modbus RTU | registers 19 to 24 |
R1C1_1: Measuring Voltage (mv) R1C1_2: Global Irradiance (W/m²) R1C1_3: Internal Temperature (°C) | serial settings (default 9600, 8N2) |
| EKO MS-80M | Modbus RTU | registers 19 to 24 |
R1C1_1: Measuring Voltage (mv) R1C1_2: Global Irradiance (W/m²) R1C1_3: Internal Temperature (°C) | serial settings (default 9600, 8N2) |
| EKO MS-80S | Modbus RTU | registers 2, 3, 8, 9, 14-17 and 20-25 |
R1C1_1: GHI (W/m²) R1C1_2: Temperature Pt100 (°C) R1C1_3: Angle of Inclination X R1C1_4: Angle of Inclination Y R1C1_5: Analog Voltage (mV) R1C1_6: Temperature (°C) R1C1_7: Humidity (%) | serial settings |
| EKO MS-80SH | Modbus RTU | registers 2, 3, 8, 9, 14-17 and 20-25 |
R1C1_1: GHI (W/m²) R1C1_2: Temperature Pt100 (°C) R1C1_3: Angle of Inclination X R1C1_4: Angle of Inclination Y R1C1_5: Analog Voltage (mV) R1C1_6: Temperature (°C) R1C1_7: Humidity (%) | serial settings: default 19200 8E1, FC: 3 |
| EKO MS-90+ | Modbus RTU | registers 4-7, 12-13, 22-23 and 28-29 |
R1C1_1: GHI MS-80S (W/m²) R1C1_2: DNI MS-90 (W/m²) R1C1_3: DHI calculated (W/m²) R1C1_4: Humidity MS-80S (%) R1C1_5: Temperature MS-80S (°C) R1C1_6: Elevation (°) R1C1_7: Azimuth (°) | serial settings, MS-90 sensitivity configured in C-Box |
| EKO M-Box | Modbus RTU | registers 19 to 24 |
R1C1_1: Measuring Voltage (mv) R1C1_2: Global Irradiance (W/m²) R1C1_3: Internal Temperature (°C) | serial settings (default 9600, 8N2) |
| EKO SMP10 | Modbus RTU | registers 5 to 10 |
R1C1_1: Solar Irradiance (W/m²) R1C1_2: Solar Irradiance Long (W/m²) R1C1_3: Temperature (°C) | serial settings (default 19200, 8E1)[a] |
| Rika RK200-03 | Modbus RTU | register 0 |
R1C1_1: Solar irradiance (W/m²) | serial settings (default 9600, 8N1), FC: 03 |
| Important |
|---|---|
MS-90+ systems are preconfigured and must be handled as a unit. The sensitivity value of MS-90 and the RS-485 address of the MS-80S are already configured in the C-Box. It is very important to keep the system as a unit and don't exchange the sensors without adapting the C-Box configuration to prevent communication problems and data loss. |
10.12.2. Delta-T Sunshine SPN 1
The pyranometer Delta-T Sunshine SPN 1 measures global horizontal and diffuse irradiation in W/m². It provides 2 analog voltage outputs (Ax) for global and diffuse irradiation, and 1 digital output (Dx) for sunshine duration.
Additionally, Meteo-42 estimates the direct normal irradiation based on the values of global horizontal and diffuse irradiation according to the general formula: Global Horizontal Irradiation = Diffuse Horizontal Irradiation + Direct Normal Irradiation * cos(θ), where θ is the solar zenith angle
The order number for Delta-T Sunshine SPN 1 is S65100.
| Important |
|---|---|
In order to estimate direct normal irradiation (DNI) and sun status, latitude and longitude of the measurement station have to be entered in the → menu (see also Section 4.2, “System Administration”). If any estimated values should be included in the CSV statistics file, the values have to be selected in the → menu under Select statistics (see also Section 6.3.1, “Configuring Statistics and CSV files”). |
| Note |
|---|---|
For technical details and electrical characteristics of sensors, refer to the data sheets, which can be downloaded from the Ammonit website. |
10.12.3. Pyrheliometers
Pyrheliometers are used to measure the direct irradiance emitted by the sun in a 5 degree angle. The sensors have to be connected to the analog voltage channels (Ax) of Meteo-42.
The output signal (U) from the pyrheliometer is proportional to the solar irradiance (E) in W/m².
Equation 10.11. Calculation of Direct Solar Irradiation (E)
Sensitivity is an internal parameter of the sensor, which is important
to calculate the irradiation in W/m². The value is given in the calibration certificate
of the sensor.
Meteo-42 indicates for pyrheliometers direct normal irradiation. Additionally, the data logger estimates DNI * cos(θ) and sun status based on the recorded values for direct normal irradiation. In order to estimate sun status and DNI * cos(θ), latitude and longitude of the measurement station have to be entered in the → menu (see also Section 4.2, “System Administration”)
The sensor often comes with built-in Pt100 sensor and thermistor. The Pt100 sensor can be connected to the current source (see Section 11.4, “Connecting Sensors to Current Source”) of Meteo-42.
If the built-in Pt100 sensor should be connected to Meteo-42, pyrheliometer and Pt100 sensor have to be configured separately in the Sensor Helper: Pyrheliometer via sensor type Solar Sensors and Pt100 via sensor type Hygro/Thermo.
| Important |
|---|---|
Do not connect the thermistor to Meteo-42! |
Table 10.20. Pyrheliometers
| Sensor | Order-No |
|---|---|
| EKO MS-56 | S64210 |
| Kipp & Zonen CPH1 | S62210 |
| Important |
|---|---|
In order to estimate sun status and direct normal irradiation [DNI * cos(θ)], latitude and longitude of the measurement station have to be entered or acquired with a GPS device in the → menu (see also Section 4.2, “System Administration”). If any estimated values should be included in the CSV statistics file, the values have to be selected in the → menu under Select statistics (see also Section 6.3.1, “Configuring Statistics and CSV files”). |
| Note |
|---|---|
For technical details and electrical characteristics of sensors, refer to the data sheets, which can be downloaded from the Ammonit website. |
10.12.4. Sunshine Duration Sensors
Sunshine duration sensors indicate the sunshine status as defined by the WMO (sunshine = irradiation exceeds the level of 120 W/m²). The sensor measures the irradiation and switches the output voltage high or low to indicate sunny or not sunny conditions.
Sunshine duration sensors, e.g. Kipp & Zonen CSD 3, have to be connected to analog voltage channels (Ax). If direct irradiation should be measured, connect this output also to another analog voltage channel (Ax). Refer to Figure 13.2, “Electrical Connection Plan: Analog Voltage (Pyranometer)” for the connection diagram.
The output signal (V) indicates sunshine or no sunshine. Additionally, the calculated direct irradiation can be measured. The output signal (mV) for direct irradiation is proportional to the direct irradiation (W/m²).
Equation 10.12. Calculation of Solar Irradiation (E)
Sensitivity is an internal parameter of the sensor, which is important
to calculate the radiation in W/m². The value is given in the calibration certificate of
the sensor.
Meteo-42 saves all electrically measured values in
V to the source data
(Section 6.7, “Access to Source Data”). The calculated values for direct irradiation are saved
in
W/m² to the CSV file (see
Section 6.6.1, “Ammonit Meteo-42 specific details”).
Table 10.21. Sunshine Duration Sensors
| Sensor | Order-No |
|---|---|
| Kipp & Zonen CSD 3 | S61910 |
| Note |
|---|---|
For technical details and electrical characteristics of sensors, refer to the data sheets, which can be downloaded from the Ammonit website. |
Meteo-42 saves all electrically measured values to the source data (Section 6.7, “Access to Source Data”). The calculated direct irradiation in W/m² and the current sun status are saved to the CSV file (see Section 6.6.1, “Ammonit Meteo-42 specific details”).
| Note |
|---|---|
The CSV file contains for all active channels the electrical values according to the chosen statistical interval. |
10.12.5. Solar Trackers
EKO Instruments high precision STR Sun Tracker provide high tracking reliability, enhanced functionality with fully automated set up procedure through a built in GPS receiver. The compact sun trackers are suited to support all kinds of measurement sensors to measure Global, Diffuse and Direct Radiation.
EKO Sun Trackers must be connected to an RS-485 client port by means of an RS232 to RS-485 adapter.
Date, time and location are acquired from the sensor by means of commands TM and LO. If the data logger values are significantly different, Meteo-42 will get automatically synchronized and the changes will be logged in the logbook. This synchronization happens in two cases: when configuring the sensor and, if RS-485 sensors check is active, on every CECS reboot. If you want to trigger the synchronisation routine, you can access the configured EKO Sun Tracker for editing and save it again without changing the configuration.
According to the configured polling rate, which is 1 s per default, the calculated angle according to the GPS information and the current angle are requested and recorded.
| Important |
|---|---|
Make sure that no other method to synchronize date and time is active (Section 4.2, “System Administration”). |
Table 10.22. Data request for RS-485 Sun Tracker
| Model | Protocol | Description | Channels / Evaluated Data | Required Configuration |
|---|---|---|---|---|
| EKO Sun Tracker | EKO | Commands MR and CR |
R1C1_1: Azimuth calculated (CR) R1C1_2: Altitude calculated (CR) R1C2_1: Azimuth (MR) R1C2_2: Altitude (MR) | serial settings |
10.12.6. Rotating Shadowband Irradiometer
Measure Global, Diffuse and Direct Radiation from two LiCor sensors as well as the temperature. The average values from both sensors are also calculated.
Table 10.23. Configuration of RS-485 CSPS RSI
| Model | Protocol | Description | Channels / Evaluated Data | Required Configuration |
|---|---|---|---|---|
| CSPS RSI | Modbus RTU | Registers 0 to 20 |
R1C1_1: Global Horizontal Irradiance (GHI) R1C1_2: Diffuse Horizontal Irradiance (DHI) R1C1_3: Direct Normal Irradiance (DNI) R1C1_4: Temperature R1C1_5: GHI LiCor 1 R1C1_6: DHI LiCor 1 R1C1_7: DNI LiCor 1 R1C1_8: GHI LiCor 2 R1C1_9: DHI LiCor 2 R1C1_10: DNI LiCor 2 | serial settings |
10.12.7. Reference Cell
Table 10.24. Configuration details for RS-485 Reference Cell
| Model | Protocol | Description | Channels / Evaluated Data | Required Configuration |
|---|---|---|---|---|
| Datasol MET Reference Cell | Modbus RTU | registers 96 to 108 |
RxCy_1: Solar irradiance Avg. (W/m²) RxCy_2: Solar irradiance 1 (W/m²) RxCy_3: Solar irradiance 2 (W/m²) RxCy_4: Wind Speed (m/s) RxCy_5: Temperature Air (°C) RxCy_6: Temperature Panel (°C) | serial settings, address |
10.12.8. Solar Module Surface Temperature Sensors
Sensors for measuring photovoltaic module temperature.
Table 10.25. Implementation details for surface temperature sensors
| Model | Protocol | Description | Channels / Evaluated Data | Required Configuration |
|---|---|---|---|---|
| Temperature Sensor for Solar Module IMT Technology Tm-RS485-MB | Modbus RTU | register 7 |
RxCy_1: Temperature (°C) | serial settings (default 9600 8N1), address (default 1) |
| Temperature Sensor for Solar Module IMT Technology Tm-Pt1000-box with Connection Box | Analog |
Ax: Temperature (°C) |
10.13. Precipitation Sensors
10.13.1. Rain Gauge
Precipitation sensors are designed to measure the quantity and intensity of precipitation striking the earth’s surface. Precipitation is best measured with a tipping bucket device. Precipitation, collected over a surface of 200 cm², is moved through an inflow sieve into a tipping bucket. When the bucket has collected 2 cm³ = 0.1 mm of precipitation, it tips over. This measurement principle is based on the “Guide to Meteorological Instruments No 8, WMO”. Precipitation sensors are typically applied for meteorological assessments.
Precipitation sensors, e.g. Young precipitation sensor, have to connected to counter channels (Cx). Refer to Figure 13.10, “Electrical Connection Plan: Pulse Counter with Pull-up Module for Precipitation Measurement” for the connection diagram.
The output signal (I) from the sensor is proportional to the precipitation quantity (N).
Equation 10.13. Calculation of Precipitation Quantity (N)
Slope is an internal parameter of the sensor, which is important to
calculate the precipitation quantity according to the measurement rate set in the sensor
configuration. The value is pre-configured in the
Sensor Helper (see
Section 5.1.2, “Sensor Helper”).
Table 10.26. Parameters for the configuration of precipitation sensors
| Sensor | Order-No | Slope | Offset |
|---|---|---|---|
| Thies Precipitation Sensor | S71100H | 0.1 mm/I | 0 mm |
| Young Precipitation Sensor | S73100 / S73100H | 0.1 mm/I | 0 mm |
| Important |
|---|---|
If you install calibrated sensors, enter the values given in the calibration protocol. |
Meteo-42 saves all electrically measured values in
Pulse [I] to the source data
(Section 6.7, “Access to Source Data”). The calculated values are saved to the CSV file (see
Section 6.6.1, “Ammonit Meteo-42 specific details”).
| Note |
|---|---|
The CSV file also contains for all active channels the electrical values according to the chosen statistical interval. |
| Important |
|---|---|
If you plan to install precipitation sensor Thies or Young, you have to implement an accessory module! Refer to the data sheet and contact Ammonit for further details. |
| Note |
|---|---|
For technical details and electrical characteristics of sensors, refer to the data sheets, which can be downloaded from the Ammonit website. |
10.13.2. Laser Precipitation Monitors
Laser precipitation monitors measure various precipitation details, i.e. intensity of total, liquid and solid precipitation as well as the precipitation amount and the SYNOP parameter.
Thies Laser Precipitation Monitor (LPM) sensor performs a new calculation every minute, after the first 5 minutes of operation. Meteo-42 requests data with a 1 s rate in order to guarantee a valid measurement per minute with a working sensor.
Thies LPM has to be connected to RS-485 client port.
Table 10.27. Configuration of RS-485 Laser Precipitation Monitor Sensors
| Model | Protocol | Description | Channels / Evaluated Data | Required Configuration |
|---|---|---|---|---|
| Precipitation Monitor Thies Laser | Thies | Telegram 8 |
RxCy_1: SYNOP RxCy_2: Intensity total precipitation RxCy_3: Intensity liquid precipitation RxCy_4: Intensity solid precipitation RxCy_5: Precipitation amount | Serial settings, address, half duplex mode, no automatic telegram sending |
| Note |
|---|---|
SYNOP (surface synoptic observations) is a numerical code used for reporting weather observations, also called FM-12 by the World Meteorological Organization. Refer to Thies LPM sensor's manual for more information. |
10.14. Multifunction Transducer, Power Meters and other Electrical Measurement Devices
Meteo-42 can be used to connect power meters, multifunction transducers or other electrical measurement devices, e.g. for power curve measurement. The devices are connected to a Meteo-42 RS-485 client port (see Section 11.6, “Connecting Sensors to RS-485 Client”).
| Model | Protocol | Description | Channels and Evaluated data | Sensor's previous configuration needed |
|---|---|---|---|---|
|
Sineax DM5S (see Section 10.14.1, “Sineax Measuring Units”) | Modbus RTU |
Actual values (addresses 40108 to 40112, 40118 to 40122, 40126, 40134, 40150) |
RxCy_1: Voltage phase L1 to L2 (U12) RxCy_2: Voltage phase L2 to L3 (U23) RxCy_3: Voltage phase L3 to L1 (U31) RxCy_4: Current in phase L1 (I1) RxCy_5: Current in phase L2 (I2) RxCy_6: Current in phase L3 (I3) RxCy_7: Active power system (P = P1 + P2 + P3) RxCy_8: Reactive power system (Q = Q1 + Q2 + Q3) RxCy_9: System frequency (F) | Serial settings, address |
|
Sineax CAM (see Section 10.14.1, “Sineax Measuring Units”) | Modbus RTU |
Actual values (addresses 40100, 40118 to 40122, 40134 to 40142) |
RxCy_1: System voltage (U) RxCy_2: Current in phase L1 (I1) RxCy_3: Current in phase L2 (I2) RxCy_4: Current in phase L3 (I3) RxCy_5: Active power system (P) RxCy_6: Active power phase 1 (P1) RxCy_7: Active power phase 2 (P2) RxCy_8: Active power phase 3 (P3) RxCy_9: Reactive power system (Q) | Serial settings, address |
|
Iskra MT540 (see Iskra manuals download) | Modbus RTU |
Normalized actual values (registers 804, 809 to 811, 816 to 819, 823) |
RxCy_1: Average phase Voltage U RxCy_2: Current I1 RxCy_3: Current I2 RxCy_4: Current I3 RxCy_5: Real Power P1 RxCy_6: Real Power P2 RxCy_7: Real Power P3 RxCy_8: Total Real Power P RxCy_9: Total Reactive Power Q | Serial settings, address |
| GD2000 Multi-function Power Analyzer | Modbus RTU | registers 56 to 63 |
RxCy_1: Active power RxCy_2: Power factor RxCy_3: Reactive power RxCy_4: Apparent power | Serial settings (19200 bps), address |
| SYCBA Monitor | Modbus RTU | registers 0 to 6 |
RxCy_1: Analog Voltage Load RxCy_2: Analog Current Load1 RxCy_3: Analog Current Load2 RxCy_4: Analog Current Load3 RxCy_5: Analog Current Load4 RxCy_6: Analog Voltage Charge | Serial settings (default 9600 8N1), address (default 1) |
10.14.1. Sineax Measuring Units
The Sineax DM5 and CAM are universal measurement devices for heavy-current systems.
For more information refer to Gossen Metrawatt Sineax documentation.
10.14.2. SYCBA Monitor Power Meter
SYCBA Monitor can monitor the consumption and power system of equipment powered by direct current through autonomous power systems. Typical applications are to monitor the load and consumption operation of systems with photovoltaic (or mini-wind) power and with batteries to power devices in 12 or 24 VDC or monitor night beacons, heating systems, timed operation systems, etc.
| Important |
|---|---|
For the operation Meteo-42 the internal biasing of the device must be disabled. This is done by setting S1 (SW1-SW4) switches to OFF. |
10.15. Remote Sensing
10.15.1. ZX 300 LiDAR
Meteo-42 can acquire LiDAR ZX 300 live and averaged wind data measurements and
include them in the measurement CSV files or share them over SCADA. At the the sensors
list under Other Sensor, you can select LiDAR ZX 300
for averaged data or LiDAR ZX 300 Live for live data.
The LiDAR ZX 300 must be powered and connected to an RS-485
client port of the Meteo-42 before configuring it, otherwise an error will appear and the
sensor will not be saved. The heights will be automatically requested from the sensor. For
each height, an RS-485 channel (RxCy) will be configured. If both live and averaged data
are requested, a maximum of 4 heights can be set at the LiDAR ZX
300.
| Note |
|---|---|
For more information about how to electrically connect |
| Important |
|---|---|
Measurement polling interval for averaged data is 1 minute per default. To ensure a valid measurement per interval it must always be lower than the statistics time interval (see Section 6.3, “Statistics Data Files”). |
Table 10.28. Requested values
| Model | Protocol | Description | Channels / Evaluated Data | Required Configuration |
|---|---|---|---|---|
| LiDAR ZX 300 | Modbus RTU | Averaged wind data per height (registers 4096-4103, 4116-4121 and 4150-4153) |
RxCy_1: Reference RxCy_2: Wind Speed RxCy_3: Vertical Wind Speed RxCy_4: Wind Direction RxCy_5: Temperature RxCy_6: Air Pressure RxCy_7: Humidity RxCy_8: Wind Speed Max RxCy_9: TI | Serial settings, address |
| LiDAR ZX 300 Live | Modbus RTU | Live wind data per height (registers 1-7 and 21-26) |
RxCy_1: Reference RxCy_2: Wind Speed RxCy_3: Vertical Wind Speed RxCy_4: Wind Direction RxCy_5: Temperature RxCy_6: Air Pressure RxCy_7: Humidity | Serial settings, address |
10.16. Bats Detection
10.16.1. Song Meter SM3BAT/SM4BAT
It is possible to connect the Wildlife Acoustics Song Meter SM3BAT or SM4BAT FS to an RS-485 client interface. This allows a real time monitoring of bat passes and pulses, as well as of the status of the SM3BAT/SM4BAT flash memory card and power supply.
| Note |
|---|---|
An external RS232 to RS-485 adapter is required. |
Table 10.29. Requested values
| Model | Protocol | Description | Channels / Evaluated Data |
|---|---|---|---|
| SM3BAT | ASCII[a] | Protocol compatible with Thies |
RxCy_1: Internal Voltage (V) RxCy_2: Internal Temperature (°C) RxCy_3: Flash memory level (%) RxCy_4: Bat passes Mic0 RxCy_5: Bat pulses Mic0 RxCy_6: Bat passes Mic1 RxCy_7: Bat pulses Mic1 |
| SM4BAT FS | ASCII[a] | Protocol compatible with Thies |
RxCy_1: Internal Voltage (V) RxCy_2: Internal Temperature (°C) RxCy_3: Flash memory level (%) RxCy_4: Bat passes RxCy_5: Bat pulses |
Scheduling: The SM3BAT can be programmed to monitor during specific periods of the day, and “sleep” during other parts of the day to conserve power. When the SM3BAT is sleeping, it will not respond to Meteo-42 messages. Thus, the SM3BAT needs to be programmed when to be monitoring for bats e.g. 24 hours or just at night, etc..
Recording: The SM3BAT normally records the ultrasonic echolocation audio data on up to 4 SDHC or SDXC flash cards. Full spectrum recordings can typically consume 1-2GB of card space per night depending on bat activity. The flash cards will eventually fill up. Normally, the SM3BAT would shut down if it is no longer able to make recordings. However, for this application, it is desirable to continue monitoring, updating bat counters, and responding to requests. If the interface to Meteo-42 is detected, then the SM3BAT will continue monitoring for bats even if the flash cards are full, but no new bat activity data will be recorded. This condition is indicated by the flash card 100% full indication in the response messages.
Bat Activity: Echolocating bats typically produce individual ultrasonic “pulses” continuously while they fly for navigation, avoiding obstacles, and hunting for food. The frequencies, bandwidth and duration of pulses vary from species to species and with the functional needs of the bat at the time (e.g. many bats will increase bandwidth and decrease duration as they close in on prey). The SM3BAT can be configured to recognize pulses that may be tuned to specific bats in a given area. This includes specifying the minimum and maximum frequencies and minimum and maximum durations of a pulse. These parameters can be tuned to recognize echolocating bats while avoiding false positives from other ultrasonic noise sources such as wind, rain, and insects. The optimum parameters will depend on the specific bats and insects likely occurring in a given area. A “bat pass” refers to a series of pulses recorded as a bat flies by the microphone. Additional parameters in SM3BAT help define what a bat pass is including the maximum trigger duration and the maximum time between pulses (the trigger window). A bat pass begins with the first detected pulse, and ends when either no pulses have been detected after the maximum time between pulses has occurred, or when the maximum trigger duration has been reached. SM3BAT will not count a bat pass unless it contains at least two pulses. In this way, the SM3BAT can count passes and pulses detected on an ongoing basis and report these counts to the customer equipment.
10.17. Lightning Detector
10.17.1. SG1000 Lightning Detector
The SkyScan SG1000 lightning detector can detect the presence of lightning or thunderstorm activity occurring within 64 km of your location. It detects the characteristic electromagnetic emissions from individual lightning strokes and uses patented technology to determine the distance to the detected stroke. The distances are indicated in four ranges: 0-5 km; 5-13 km; 13-32 km; and 32-64 km. This allows you to track the approach of dangerous storm activity.
| Note |
|---|---|
More than one range can be detected simultaneously. |
SG1000 may also identify certain types of especially strong storms. These storms can produce dangerous winds, heavy rains or tornadoes. When SG1000 detects lightning patterns indicating the presence of these storms, it activates the Severe thunderstorm alarm.
Four digital signals with complementary information are supplied by this lightning detector: Alarm, Error, Battery power and Baseline (see Table 10.30, “SG1000 status signals”).
Table 10.30. SG1000 status signals
| Signal | Description |
|---|---|
| 0-5km | Distance range 0-5 km |
| 5-13km | Distance range 5-13 km |
| 13-32km | Distance range 13-32 km |
| 32-64km | Distance range 32-64 km |
| Severe | Severe thunderstorm alarm |
| Alarm | Lightning activity has moved within range |
| Error | There is a system error that needs to be addressed (error code is indicated by the status LED on the unit) |
| Battery power | Mains power has been interrupted and system is operating on battery backup |
| Baseline | Ensures that there is activity on the digital output (i.e. can be used as a heartbeat to confirm system is up-and-running) |
| Important |
|---|---|
If the period of the digital output signal of the sensor is changed, it is necessary to configure the measurement rate at Meteo-42 accordingly. The period of the digital output signal can be set to a value between 2.0 and 4.8 seconds, being the default value 2.0. The measurement rate configured at the data logger for this sensor must be at least twice as long as the period duration of the digital output, in order to guarantee that a complete period is caught. The default measurement rate is 5 seconds. |
10.18. Soil Water Content
Measuring the water content, electrical conductivity (EC), and temperature of soil is a main topic for any agricultural project. Meteo-42 supports several volumetric water content (VWC) sensors, connected to an analog channel or to an RS-485 client interface.
Table 10.31. Soil Moisture Sensors
| Sensor |
|---|
| Decagon EC-20, EC-10, EC-5 Soil Moisture Sensors |
Table 10.32. RS-485 Soil Water Content Sensors
| Model | Protocol | Description | Channels / Evaluated Data | Required Configuration |
|---|---|---|---|---|
| Campbell Reflectometer CS650 | SDI-12 | D0 |
RxCy_1: Volumetric water content RxCy_2: Electrical conductivity | External module needed (address, 19200 8N1, 120Ω termination). See SDI-12. |
10.19. Soiling Measurement
Soiling is the accumulation of dust, dirt and other contaminants on the surfaces of photovoltaic (PV) modules. The amount of dust is extremely dependent on the location of the PV power plant, e.g. in a desert valley with sand storms. In the absence of significant rain events or regular cleaning, production losses due to soiling effects increase. Measuring soiling effects provides important details about the PV power plant production, e.g. how much dust can be on the modules before any problem occurs and how the dust affects transparency and efficiency of the modules.
10.19.1. Atonometrics RDE300
Soiling and Irradiance Measurement Systems with the Atonometrics RDE300 Series measurement and control unit collect critical data for evaluating PV array performance. The systems can be used at operating PV power plants and pre-construction site survey locations.
Table 10.33. Data request for RS-485 Soiling Measurement
| Model | Protocol | Description | Channels / Evaluated Data | Required Configuration |
|---|---|---|---|---|
| Atonometrics RDE300 | Modbus RTU |
R1C1_1: Global Irradiance PV1 R1C1_2: Analog Current PV1 R1C1_3: Temperature PV1 R1C1_4: Active Power PV1 R1C2_1: Global Irradiance PV2 R1C2_2: Analog Current PV2 R1C2_3: Temperature PV2 R1C2_4: Active Power PV2 R1C2_5: Soiling Ratio R1C2_6: Soiling Ratio Isc R1C2_7: Soiling Ratio Pmax R1C3_1: Event Code R1C4_1: Status Fluid R1C5_1: Status Pump | Serial settings, address |
10.19.2. Ammonit Soiling Measurement Kit SD2100
Ammonit Soiling Measurement Kit uses the measurement method short-circuit current reduction due to soiling as specified in IEC 61724-1.
The temperature-corrected short-circuit current of a clean PV module is proportional to the irradiance. The measurement station determines the short-circuit current output as well as the module surface temperature from the backside of both soiled and clean PV modules. Based on these measurements, the effective solar irradiance (Eeff) can be determined by Equation 5.10, “Calculation of effective irradiance”. The soiling ratio (SR ISC) is then obtained by dividing the measured soiled device short-circuit current by its expected short-circuit current, calculated using the normalization values previously determined (Equation 5.11, “Calculation of SR ISC normalized according to IEC 61724-1”).
Figure 10.1. Ammonit Soiling Measurement Kit
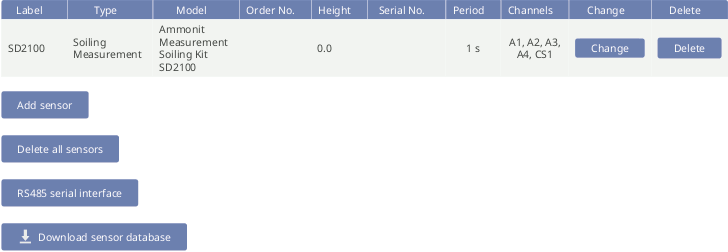
| Important |
|---|---|
Ammonit Soiling Measurement Kit does not need to be calibrated on site to a specific soiling type. When the soiling composition changes throughout the year, the sensor will still accurately measure soiling without the need for re-calibration. |
The Ammonit soiling measurement kit includes the following components: two Ammonit I-U Conversion Boxes, two Surface Temperature Sensors and two 30 W Photovoltaic (PV) Modules. PV modules must not be identical, the reference constants of each PV-module must be introduced for the effective irradiance calculation.
Figure 10.2. Ammonit Soiling Measurement Kit Effective Irradiance Soiled PV
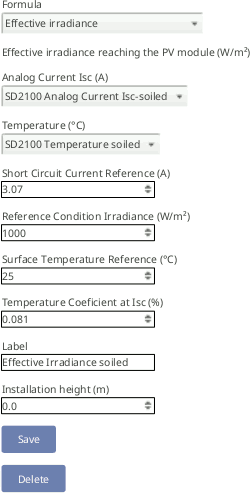
An Ampere meter is used for each of the I-U Conversion Boxes. In order to achieve best match to the output voltage, the appropriate voltage range must be selected. If you are using CM8281, with a shunt resistor of 50 mΩ, you must select the ±1.0 V voltage range.
For each surface temperature measurement, a PT100 is used.
Figure 10.3. Ammonit Soiling Measurement Kit configuration
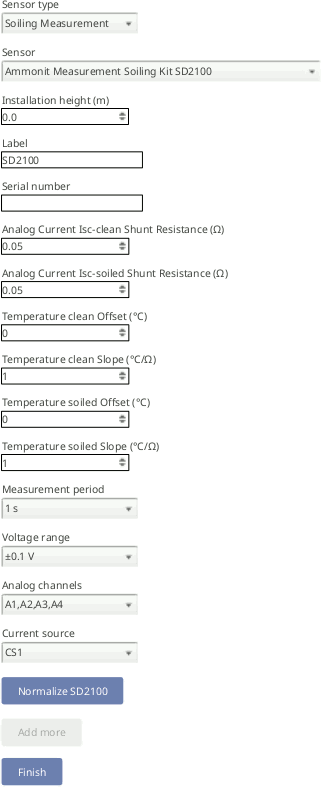
Figure 10.4. Ammonit Soiling Measurement Kit Normalization
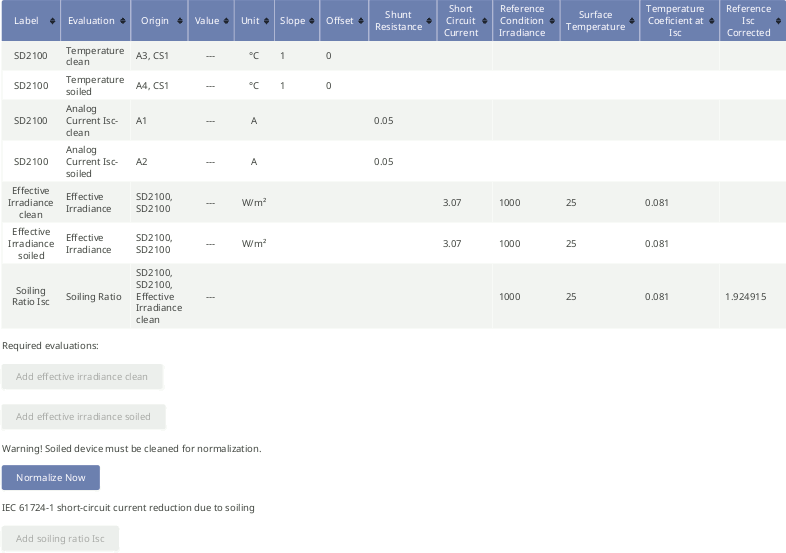
| Important |
|---|---|
Both clean and soiled device must be cleaned before the normalization process! |
The normalization of the system is performed according to the technical standard IEC 61724-1:2021. This process shall be repeated at least annually. Immediately following the normalization or following any significant rainfall, the measured soiling ratio ISC should be close to unity. If the soiling ratio ISC deviates more than 0.01 from the unity, the normalization must be repeated. Significant deviation from unity indicates a problem with the setup.
To start the normalization process you must press the Change button for the configured sensor at the sensors list. While in the sensor editing menu, you will find the option Normalize SD2100 at the bottom. For the normalization, a measurement rate of 1 second is required. Afterwards it is recommended to lower the measurement rate to 1 minute. Normalization is only possible after the effective irradiance evaluations of the clean and soiled devices have been configured. During the normalization process, the short circuit current and effective irradiance of both PV modules are measured and a corrected reference short-circuit current (ISC0Corrected) for the soiled device is calculated and saved in the configuration. This value is also reflected in the logbook. The corrected reference short-circuit current will be later applied for the soiling ratio calculation (see Soiling Ratio ISC index). The soiling ratio evaluation can only be configured after the normalization process succeeded. After renormalization, the soiling ratio evaluation will be automatically removed and must be added again.
Figure 10.5. Ammonit Soiling Measurement Kit Soiling Ratio ISC
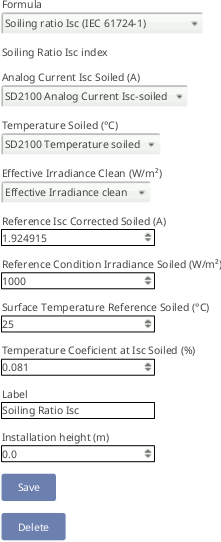
Other standard metrics for the effects of soiling on energy production are available at the Evaluation Helper.
10.19.3. Kipp & Zonen DustIQ
The Kipp & Zonen DustIQ is an instrument meant to measure and report the transmission loss (TL) and soiling ratio (SR) caused by light being blocked and reflected and subsequently not getting through the glass of the panel due to soiling of the panel.
| Important |
|---|---|
A local dust calibration of the device is required. The DustIQ leaves the factory calibrated for Arizona Test Dust (ATD) but it is very unlikely that the local dust composition matches this ATD and it is therefore advised to train each DustIQ for the local dust composition (see https://www.kippzonen.com/ for more information). |
Before and after the calibration process, Ammonit recommends to read some relevant Modbus registers to record this values in the data logger logbook. The RS-485 Serial Interface must be used: register 2 (software version), register 34 (device status flags), register 35 (calibration flags), register 36 (current sensitivity value).
Table 10.34. Data request for DustIQ RS-485 Soiling Measurement
| Model | Protocol | Description | Channels / Evaluated Data | Required Configuration |
|---|---|---|---|---|
| DustIQ | Modbus RTU | registers 20, 21, 24, 25 |
R1C1_1: Soiling Ratio 1 (%) R1C1_2: Transmission Loss 1 (%) R1C1_3: Soiling Ratio 2 (%) R1C1_4: Transmission Loss 2 (%) | Serial settings, address |
| DustIQ & temperature | Modbus RTU | registers 20, 21, 24, 25, 31 |
R1C1_1: Soiling Ratio 1 (%) R1C1_2: Transmission Loss 1 (%) R1C1_3: Soiling Ratio 2 (%) R1C1_4: Transmission Loss 2 (%) R1C1_5: Temperature (°C) | Serial settings, address |
10.20. Other RS-485 Sensors
In addition to meteorological sensors, further RS-485-compatible sensors or devices can be connected to an RS-485 client bus (see Section 11.6, “Connecting Sensors to RS-485 Client”). The following list includes some sensors and their configuration.
10.20.1. RS-485 Multiplexer
Table 10.35. Configuration details for other RS-485 Sensors / Devices
| Sensor type | Model | Protocol | Description | Channels / Evaluated Data | Required Configuration |
|---|---|---|---|---|---|
| Multi Channel Voltage Module | Gantner e.bloxx A1 | Modbus RTU | registers 17 to 32 |
RxCy_1: Analog Voltage AI1 RxCy_2: Analog Voltage AI2 RxCy_3: Analog Voltage AI3 RxCy_4: Analog Voltage AI4 RxCy_5: Analog Voltage AI5 RxCy_6: Analog Voltage AI6 RxCy_7: Analog Voltage AI7 RxCy_8: Analog Voltage AI8 | Serial settings, address, protocol, channels definition |
| Multi Channel Voltage Module | Gantner e.bloxx A3-1 | Modbus RTU | registers 17 to 26 |
RxCy_1: Analog Voltage 1 RxCy_2: Analog Voltage 2 RxCy_3: Analog Voltage 3 RxCy_4: Analog Voltage 4 RxCy_5: Digital status | Serial settings, address, protocol, channels definition |
| Multi Channel Digital Module | Gantner e.bloxx D1-1 | Modbus RTU | registers 0 to 7 |
RxCy_1: Digital status 1 RxCy_2: Digital status 2 RxCy_3: Digital status 3 RxCy_4: Digital status 4 RxCy_5: Digital status 5 RxCy_6: Digital status 6 RxCy_7: Digital status 7 RxCy_8: Digital status 8 | Serial settings, address, protocol, channels definition |
10.20.2. Configuring generic Modbus RTU sensors
It is possible to connect up to 8 Modbus RTU sensors to RS-485 client port (see Section 11.6, “Connecting Sensors to RS-485 Client”). They can be combined with other Modbus RTU sensors implemented in Meteo-42 like Lufft sensors, but not with other protocols like Thies or Gill.
Figure 10.6. Generic Modbus RTU sensor configuration
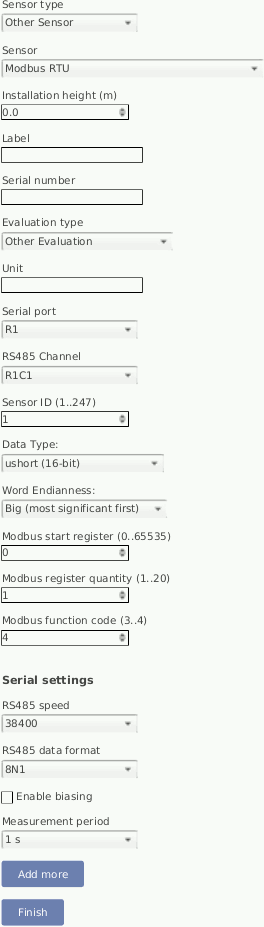
The maximum quantity of consecutive registers that can be read from each sensor is 20. It is necessary to specify the first register (PDU addressing, first reference is 0) and the amount of registers. The function code is selectable between '03' (read holding registers) and '04' (read input registers).
Read registers will be evaluated according to the selected data type (see Table 10.36, “Data types available”). If a 32-bit data type is selected, each pair of registers will be merged. For each register pair (if 32-bit data type selected) or each individual register (if 16-bit data type selected), an evaluation is generated. E.g. reading 10 registers on RS-485 channel R1C1 will generate 10 evaluations if a 16-bit data type is selected (R1C1_1 to R1C1_10) and 5 evaluations if a 32-bit data type is selected (R1C1_1 to R1C1_5).
The resulting evaluations have no unit or evaluation type. You can create a new evaluation on top of each original evaluation by means of the linear equation from the Evaluation Helper (see Section 5.3.1, “Evaluation Helper”). Finally, it is necessary to properly select the evaluations to be included in the CSV statistics files in the → (see Figure 6.3, “Statistics Selection Page”).
Table 10.36. Data types available
| Data Type | Description |
|---|---|
| short (16-bit) | 16-bit integer |
| ushort (16-bit) | 16-bit unsigned integer |
| long (32-bit) | 32-bit integer |
| ulong (32-bit) | 32-bit unsigned integer |
| float (IEEE754 32-bit) | 32-bit single precision binary floating point |
| 32-bit unsigned (8-bit exp) | 8-bit signed decade exponent, 24-bit uint |
| 32-bit signed (8-bit exp) | 8-bit signed decade exponent, 24-bit signed int |